
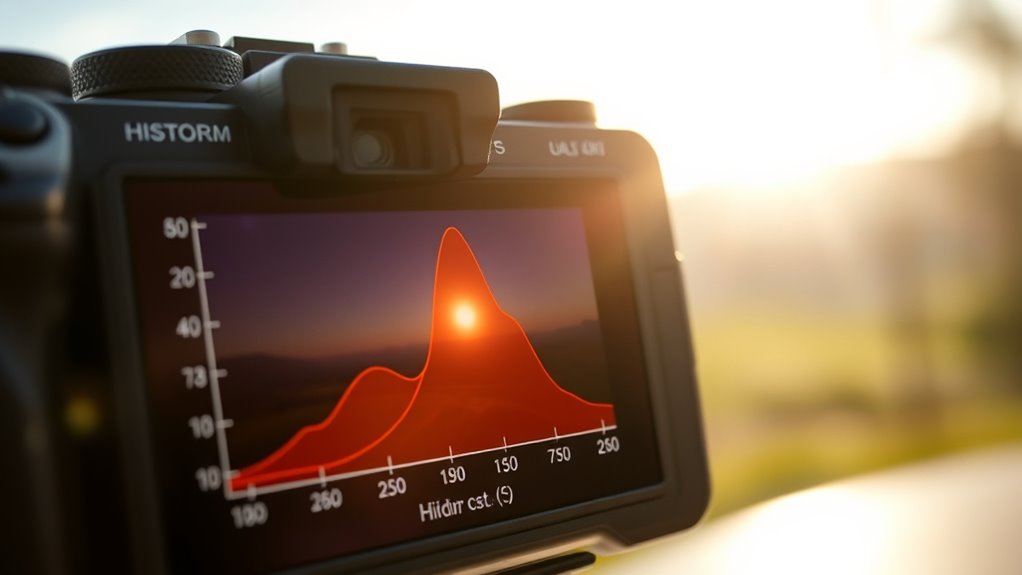
To improve your exposure, use the histogram to check how your image’s tones are distributed. Look for a balanced shape without significant clipping on either end—shadows on the left and highlights on the right. If the graph leans left, brighten the shot; if it pushes right, reduce exposure to prevent overexposure. By understanding these cues, you can adjust your settings confidently. Keep exploring, and you’ll find even more ways to master exposure with your histogram.
Key Takeaways
- Analyze the shape of the histogram: a balanced bell curve indicates proper exposure.
- Check for clipping at the left (shadows) or right (highlights) edges to prevent loss of detail.
- Use histogram shifts to adjust exposure—move left for darker scenes, right for brighter scenes.
- Recognize skewed histograms to identify dominant shadows or highlights and correct accordingly.
- Utilize histogram feedback to make quick exposure decisions and capture well-balanced images.
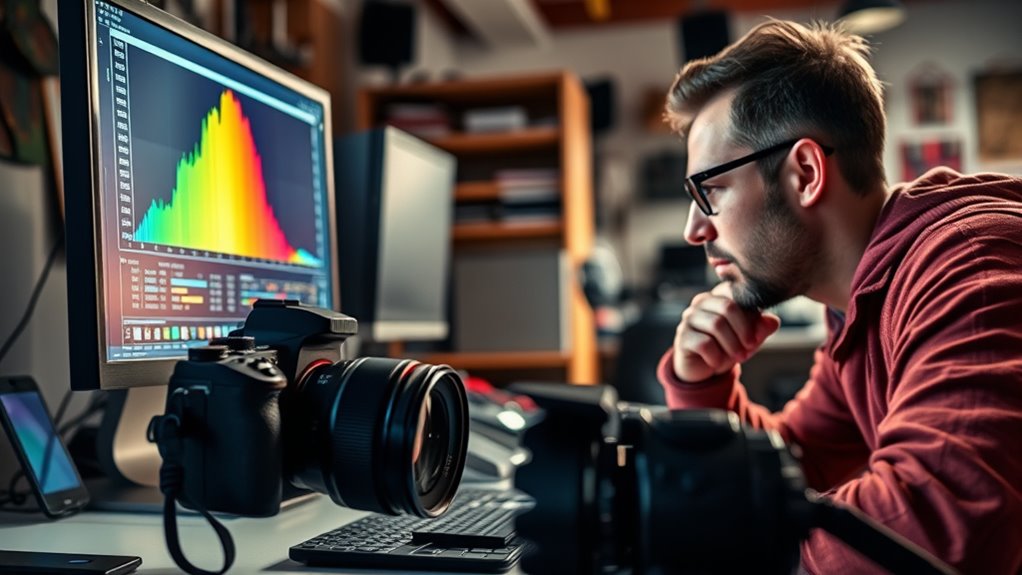
Histograms are powerful tools for visualizing data distributions, making it easier to identify patterns and trends. When you look at a histogram in photography, you’re essentially seeing a graphical representation of the tonal distribution in your image. This helps you quickly assess whether your exposure is balanced or if adjustments are necessary. One of the most critical aspects to understand is the dynamic range the histogram reveals. Dynamic range refers to the span between the darkest shadows and the brightest highlights captured in your photo. Recognizing this range allows you to determine if your image is properly exposed or if you’re losing important details in either the shadows or the highlights. When the histogram is shifted too far to the left, it indicates underexposure, with details buried in shadows. Conversely, a histogram leaning too far to the right suggests overexposure, risking blown-out highlights. Ideally, you want a well-balanced histogram that covers the full range without clipping on either end.
Next, pay attention to the tonal distribution, which shows how pixels are spread across different brightness levels. A balanced tonal distribution typically has a bell-shaped curve, with details distributed smoothly from dark to light tones. If the histogram is heavily skewed to one side, it indicates that your image is dominated by either shadows or highlights. For example, a histogram clustered on the left means most of your tones are dark, which could be intentional but often suggests underexposure. Conversely, a histogram pushed to the right might mean bright areas dominate, risking loss of highlight details. Learning to interpret these patterns helps you make precise exposure adjustments, whether you’re using manual settings or evaluating the results of your camera’s automatic modes. Understanding exposure adjustment techniques based on histogram feedback can significantly improve your photographic results.
It’s also vital to recognize that histograms can help you decide whether to increase or decrease exposure. If your histogram shows clipping in the shadows or highlights, you know you need to brighten or darken the scene, respectively. Furthermore, understanding the dynamic range displayed in the histogram guides you in capturing scenes with high contrast, such as landscapes or backlit subjects. By adjusting your camera settings or using exposure compensation based on the histogram, you can preserve important tonal details and avoid losing information in the darkest or brightest areas. Over time, familiarizing yourself with how different scenes are represented on the histogram will improve your ability to make quick, confident exposure decisions that enhance your overall image quality.

Leofoto MPL and MPL-2 Multi-Function Tool, Handy Survival Multi-Tool, Photographers Allen Wrench Kit, Carabiner for Tripod (MPL)
Camera multitool and photography tools
As an affiliate, we earn on qualifying purchases.
As an affiliate, we earn on qualifying purchases.
Frequently Asked Questions
How Can Histograms Improve My Overall Photography Skills?
Histograms improve your photography skills by helping you with exposure correction and understanding dynamic range. You can quickly see if your photo is overexposed or underexposed and make adjustments on the spot. By mastering histograms, you learn to capture a wider dynamic range, ensuring details are preserved in shadows and highlights. This skill leads to better, more balanced images and boosts your confidence behind the camera.
What Camera Settings Influence the Histogram Display?
You might find that your camera’s ISO sensitivity and aperture adjustments gently guide the histogram’s shape. Higher ISO settings brighten your image, shifting the histogram to the right, while a wider aperture lets in more light, affecting exposure and the display. By understanding how these settings influence the histogram, you can craft perfectly balanced images, ensuring details are preserved in both shadows and highlights.
Can Histograms Be Used Effectively in Low-Light Conditions?
Yes, you can use histograms effectively in low-light conditions, but be aware of sensor noise and limited dynamic range. The histogram may show more clipped shadows or highlights, so you should adjust your settings carefully. Look for a balanced histogram that avoids clipping while preserving detail. Use a higher ISO cautiously to reduce noise, and consider post-processing to recover details in shadows and highlights.
How Do I Interpret Color Histograms Compared to Black-And-White?
Color histograms show the distribution of red, green, and blue channels, helping you assess color balance. In contrast, black-and-white histograms focus on monochrome contrast, revealing tonal range and brightness. When interpreting color histograms, look for balanced peaks across channels to avoid color casts. For monochrome images, make certain the histogram covers the full tonal range for rich contrast. Both help you fine-tune exposure and achieve your desired visual effect.
Are There Specific Histogram Patterns for Different Photography Genres?
You’ll notice that histogram shapes vary by genre, with landscape photos often showing peaks in the highlights and shadows, while portraits focus on midtones. Genre-specific patterns help you quickly assess exposure, ensuring detail in key areas. For instance, street photography might display a more balanced histogram, whereas macro shots might concentrate on fine tonal ranges. Recognizing these patterns allows you to tailor your settings for ideal results.
Light Meter Digital Illuminance Meter Handheld Ambient Temperature Measurer, Range up to 200,000 Lux, Luxmeter with 4 Digit Color LCD Screen
Measures luminosity from 0 to 200,000 Lux and ambient temperature
As an affiliate, we earn on qualifying purchases.
As an affiliate, we earn on qualifying purchases.
Conclusion
Now that you know how to read histograms, you’ll see your photos in a whole new light. Understanding exposure becomes second nature, helping you capture images that are perfectly balanced. Remember, a histogram is like a map—guiding you to avoid under or overexposure. With practice, you’ll spot the signs at a glance and keep your photos looking sharp. Don’t let missteps be the rule—let the histogram be your trusty guide to better shots every time.

Sekonic L-308X-U Flashmate Light Meter (401-305)
Exposures accurate down to a tenth-of-a-stop for both ambient and electronic flash light readings in full-stop mode.
As an affiliate, we earn on qualifying purchases.
As an affiliate, we earn on qualifying purchases.

(2 Pack) DSLR/mirrorless Photography Cheat Sheets Credit Card Size Reference Card Fits in Pocket/Wallet/Camera Bag. Aperture, Shutter Speed, Exposure Triangle & Manual Mode, for Canon, Sony & Nikon
📷 QUICK PHOTOGRAPHY REFERENCE CARDS – Printed on PVC plastic making them waterproof and durable.
As an affiliate, we earn on qualifying purchases.
As an affiliate, we earn on qualifying purchases.